2. Principles and user Interface
LithoGraphX is an open source platform for the visualization and processing of 3D image data. It can visualise and manipulate 3D image stacks and triangulated curved surfaces (2½D). Surfaces can be extracted from 3D images and both can interact in various ways.
Before introducing the user interface there are a few useful definitions that come over and over in LithoGraphX.
2.1. Definitions
- Stack
- A stack is really a biological sample. Each stack has a unique size, location and resolution. It contains 2 images (stores) and a mesh. The two stores of a stack are the main and the work store. The main store is where the data is loaded by default. When the data is processed, the result is always put in the work store, using the main store as a checkpoint. They can also be used to load two different channels of a same image.
- Store
- A store is a 16 bits, single channel, 3D image. Each store has its own rendering properties (color, opacity, brightness), but they share location, resolution and size. The voxel values can be interpreter either as signal intensity or labels.
- Mesh
- A mesh is a triangulated surface. A mesh can be loaded from a file, or extracted from a 3D image. It is worth noting the surface doesn’t have to be continuous and can therefore represent many distinct objects.
- Process——-
- All non-interactive operations in LithoGraphX are performed by processes.
They are grouped into three categories: Stack, Mesh and Global. Stack and
processes cannot modify meshes, Mesh processes cannot modify Stack or
Stores and Global processes can modify anything. Processes can be used in
Python scripts or macros to automate complex pipelines. Processes are
refered as
Type.Name. For example, the processStack.Saveis a stack process used to save the current stack.
- Active Stack
- At any point in time, a single store is marked as active. The active store is the one processed by default. If a process works on meshes, the active mesh is the one associated with the active store. Before launching a process, you should always check which is the active store: it is indicated on the bottom right of the main window.
2.2. User Interface

Figure 1: User Interface
The main window (Figure 1) of LithoGraphX is organised around a central interaction area, black when you stack the application. This is also where you want to drop files to load them in their default place.
The volume and mesh toolbars offer tools to interact with either the volume or the mesh. This tools are always activated by pressing the Alt key and clicking on the interaction area. You will find a complete description of the tools in Interaction toolbars.
2.2.1. Interaction area
This is the most important area of LithoGraphX. This is where your objects are
displayed and where you can interact with them. The commands used for this area
are available either by pressing the H key when hovering above the
interaction area, or by selecting “Mouse and Keyboard” in the help menu.
2.2.2. Interaction box
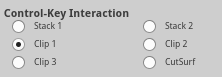
Figure 2: Interaction box
The object selected in the interaction box (Figure 2) can be moved around by presing the control key and using the same mouse movement as for moving the camera.
2.2.3. Global toolbar
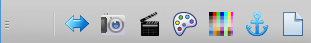
Figure 3: Global toolbar
See Figure 3.
- Current label
- The most important function of the global toolbar is to visualize and reset the current label. The left-most button (transparent in the image above), indicate which is the current label. You can see its color on the tool and the tooltip will give you its exact number. Cliking on it will reset the label to 0 (e.g. no label selected).
 Swap surfaces
- This tool is used when co-segmenting meshes and is described in the appropriate protocol.
 Save screenshot
- As the name suggest, this tool brings the screenshot interface to capture the interaction area in an image.
 Record video
- This allows to take a screenshot every time the image changes. This can be handy to record a movie.
 Color palette
- This tool opens a dialog box used to change the colors used in the interaction area: background, mesh lines, text, …
 Edit labels
- This tool opens a dialog box used to change the number of colors used when representing labeled stacks or meshes. It also allows to change which colors are used for which label.
 Reset view
- This is a panic button when you loose your objects. It will reset the view, including the positions of the stacks, the clipping planes and the cutting surfaces you may have moved.
 Edit project file
- This tool opens a simple text editor from which you can edit the project file directly. This is for advanced users only!
2.2.4. Interaction toolbars

Figure 4: Interaction toolbars
To use the tools of the intefaction toolbar (Figure 4), you need to press the Alt key while clicking (see Configuring the Alt key under Linux).
2.2.4.1. The volume tool bar
 Pick volume label
- Set the current label to the one the user click on.
 Delete volume label
- Pick a label on a 3D stack and erase it (e.g. replace it with zeros). It is done using the Stack.Fill Label process, setting the new label to 0.
 Pixel edit
- This tool allows you to change pixels values on the work store of a stack. What the pixels are changed to is decided on the Stack Editing.
 Fill volume label
- Pick a label and replace it with the current label. This is using the process Stack.Fill Label, setting the new label to the active one.
2.2.4.2. The mesh tool bar
- Pick label
- Set the current label to
 Mesh select
- Select vertexes on the active mesh or the cutting surface. The selection is one by drawing a rectangle: every vertex within the rectangle will be selected. To use it, the points of the mesh or cutting surface must be visible. By default, at every click, the selection is replaced. To avoid this, press Shift while clicking.
 Mesh label select
- Pick a label and select all the vertexes having this label.
 Select connected area
- Extend the current selection to all vertexes connected to it.
 Add new seed
- At each click on the mesh, this tool selects a new seed and label the triangle (e.g. all three vertexes) with it. The seed will be used while the mouse move until the button is released.
 Add current seed
- Set the label of the triangles you click on to the current label.
 Grab seed
- When co-segmenting surfaces, this grab the seed from the other surface and apply it to the triangles being clicked on.
- Fill label
- Replace the label clicked on by the current one.
- Delete picked label
- Delete all vertexes having the label clicked. The deletion only happen when the mouse button is released, giving the opportunity to select more than one label by moving the mouse, keeping the left button pressed.
 Erase selection
- Erase the label of all the selected vertexes.
 Fill selection
- Set the label of all selected vertexes to the current one.
 Delete selection
- Delete selected vertexes
2.2.5. Tab Area
2.2.5.1. Main tab

Figure 5: Main tab
The main tab (see Figure 5) controls what is displayed and how.
The stack tab select the current stack: you can check this looking at the bottom right corner of the window.
The main and work store areas are identical:
- the main check box controls their visibility
- the button is used to control the transfer function
- the 16 bits check box controls whether the image is displayed using the full 16 bits or only 8 bits. If rendering is too slow, you can try to un-check it.
- the labels check box indicate whether the image is interpreter as signal intensity or labels.
- the opacity and brightness sliders are rather self-explanatory
The display of the mesh is part in two: the surface and the mesh itself.
The surface area controls the surface representation of the mesh:
- the top button controls the transfer function for the mesh’s signal
- the bottom button controls the transfer function for the heat
- the view combo box controls what is displayed on the surface: signal, label, heat or parent label.
- the bottom three radio buttons control whether the surface displays its own information (Surface), the texture attached to it (tex) or the part of the 3D image intersecting the surface (Img).
The mesh area control the display of the wireframe representation of the mesh:
- The view combo box allows to select what part of the mesh is visible. Options are: selected, all, cells and border. Cells show the border of cells and border the border of the mesh (in case it is an open surface).
- It is possible to display the lines or the points of the mesh. Note that to select the mesh, it is necessary to display its points.
- The Map check box show the labels of each cells as text above the image itself.
- At last the
 button gives information about the whole
stack and mesh: size, resolution, number of vertices, range of the signal,
what has been computed, …
button gives information about the whole
stack and mesh: size, resolution, number of vertices, range of the signal,
what has been computed, …
The scaling and position area controls global properties of the stack:
- The stack has two position matrices: normal and transformed. The Transform check box control which one is displayed / modified. Processes should always change the transformed position.
- The BBox check box control whether the bounding box of the image is displayed.
- The Scale check box control whether the display size of the stack and mesh is the original one, or the one scaled by the sliders.
- The three sliders control the scaling of the whole stack (including the mesh) along the local X, Y and Z axis. If the tied check box is ticked, the three sliders are forced to the same value.
2.2.5.2. View tab

Figure 6: View tab
The view tab (see Figure 6) is split in 3 sections: image quality, stack editing and clipping planes.
2.2.5.2.1. Image Quality
The view tab is split into 4 boxes. The image quality box controls global rendering properties. Beside the common brightness and contrast, you can set the number of slices used to render 3D images: the more slices, the better the rendering, but also the slower. To get a feel for what it does, do not hesitate to descrease it to the minimum (on the left). The last parameter is the sampling. When the view moves, instead of rendering the full view, LithoGraphX degrades the image by rendering only a fraction of the pixels. This allows for a precise rendering when the image is still while keeping a fluid movement. If you change this slider, check the result by moving the view.
Note
Most sliders can be reset to their default position by double-clicking on them!
2.2.5.2.2. Stack Editing
The second box is the stack editing box. First, you will notice it is grayes: it will become available when the current store is the work store of a stack (otherwise, you cannot use the Pixel Edit tool anyway). The main control here is the slider, which decides how large the editing pencil is. The size is in screen coordinate, so how much of the object you are editing will also depend on the level of zoom. The default behavior of the pixel edit tool is to erase voxels (e.g. set them to 0). You can choose instead to fill the voxels with other values. Depending on the store (e.g. whether it contains labels or intensity), you will be able to set the value used to fill the stack, or choose to create a new seed at every click.
2.2.5.2.3. Clipping Planes
LithoGraphX provides 3 pairs of clipping planes. Each pair are maintained parallel to allow for easy slicing of the objects. To use the clipping planes, first show the grid, checking the grid check box. Select the clipping plane in the Interaction box and move it wherever you need before checking the Enabled box. It is usually easier to move it in place before enabling it.
2.2.5.3. Process tab

Figure 7: Process tab
LithoGraphX has three kinds of Processes: Stack, Mesh and Global. The three first tabs each list one of the categories.
Within these tabs (see Figure 7), processes are organised in folders, which can be open and closed by clicking on the triangle on their left. When a process is selected, its parameters appear in the bottom part of the tab. Be aware that some processes will also provide a dialog box to help you with the parameters. Although the parameters written there will always be taken into account.
The last tab contains tasks. Tasks are ordered collections of processes, usually organized to make protocols easier to follow. Tasks can group processes of all types. They can be saved and loaded from files.